

Sales drop, but traffic looks normal. Or sessions go up while orders barely move. The dashboard tells you something changed. It does not tell you why. That is the useful role of Shopify Analytics. Treat each metric as a signal, then work out what changed before touching your ads, products, or storefront.
Start With a Business Question, Not the Dashboard
Do not open Analytics and scan every number. Start with one clear question. Why did orders fall? Why did average order value drop? Are repeat purchases slowing?
Build your Shopify analytics dashboard around the numbers you actually use. Shopify lets merchants customize the Analytics overview dashboard, so there is no reason to keep metrics that never lead to a decision.
When Sales Change, Break the Number Down First
A sales change is not the answer. It is the starting point. Use Shopify sales reports to check what moved underneath the total. Look at sessions, conversion, average order value, product mix, discounts, and stock.
If sales are down 10% but traffic is almost unchanged, traffic probably is not the first issue. Check conversion, product availability, and what customers are actually buying before changing the whole store.
Traffic Is Up, but Orders Are Flat: Check the Funnel
Sessions went up, but orders did not. Now look at the Shopify conversion rate across the full buying journey:
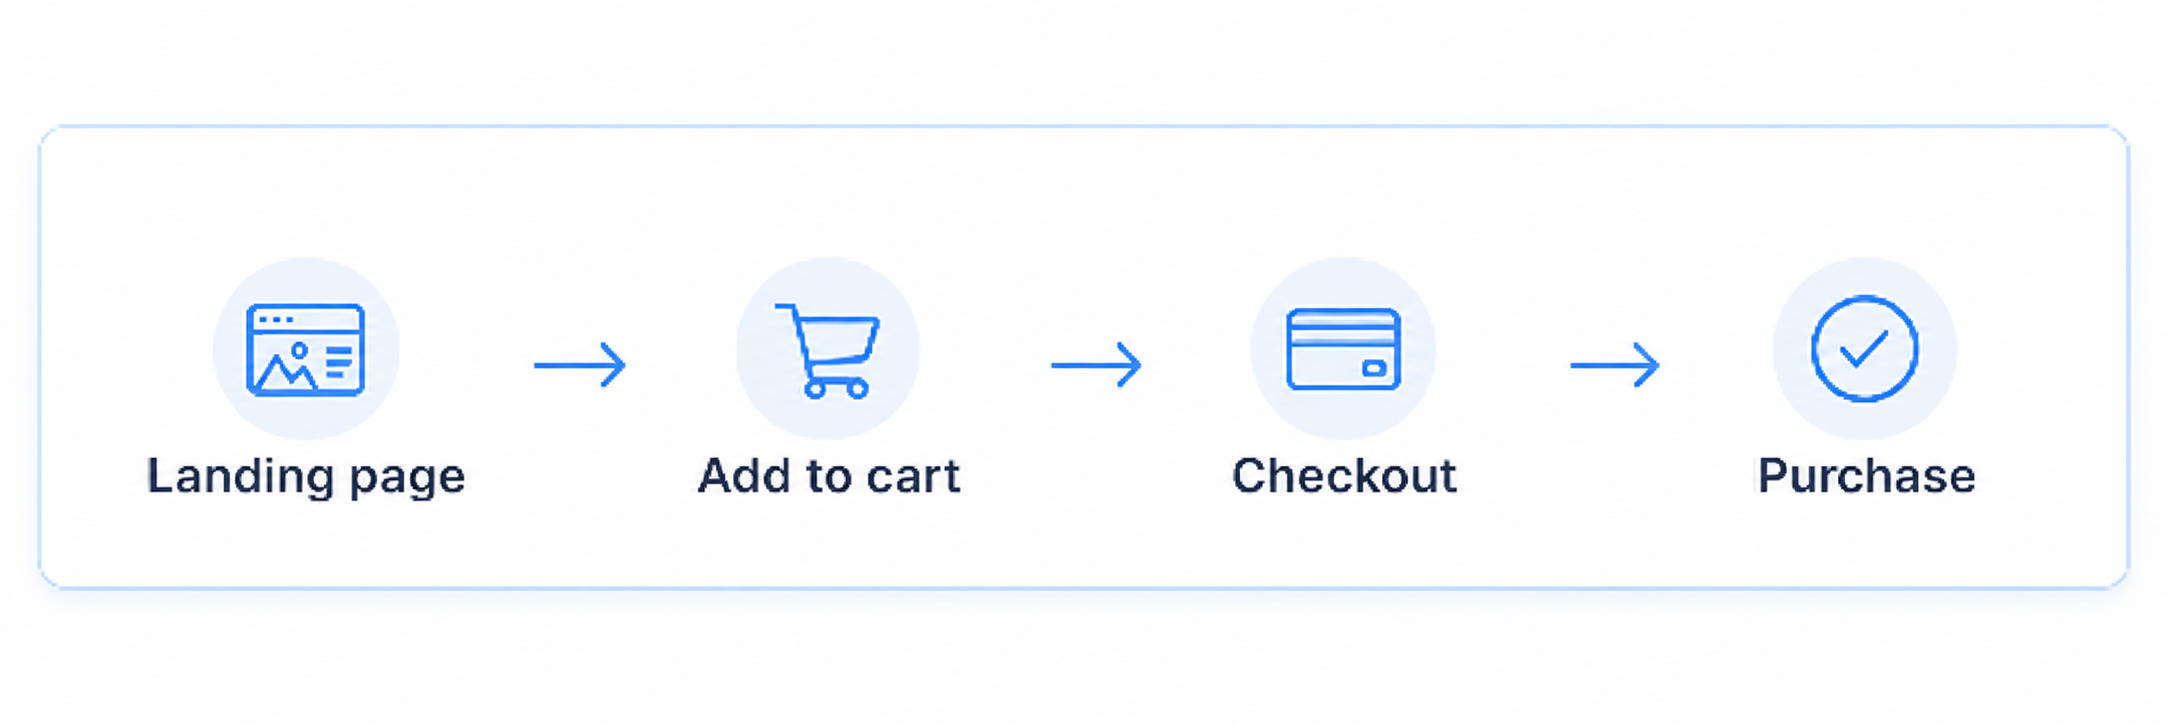
If shoppers add products to the cart but fewer reach checkout, focus on that part of the journey. If mobile traffic grows while conversion falls, compare mobile and desktop before blaming the campaign. The number becomes useful once you know where the drop is happening.
Look Beyond the First Order
Do not judge a marketing channel only by how many first orders it brings. Use Shopify customer reports to look at new and returning customers, repeat purchases, and retention. A source can bring cheap first orders and still produce customers who never buy again.
purchases, and retention. A source can bring cheap first orders and still produce customers who never buy again.
Over time, Shopify cohort analysis can help show whether customers from a certain period or campaign return and spend again. The cheapest first sale is not always the best customer.
Use Product and Inventory Data Together
A best seller is not automatically your strongest product. Look at units sold, stock level, discounts, margin, and availability together. A product may sell quickly because it is heavily discounted, while another item brings better margin with fewer sales. That changes what you restock, feature, or promote next.
When the Data Points to Store Performance, Check the Store
If mobile traffic looks healthy but mobile conversion is weaker, open the store on an actual phone.
Check page load, large images, app scripts, layout movement, menus, and product-page usability. These issues can affect Shopify store performance even when your traffic looks fine.
If the numbers point toward loading or page-experience problems, it is worth checking the real cost of a slow Shopify store. SpeedBoostr can then support the technical side with speed and storefront performance tools.
Checking more reports is not the goal. Use Shopify Analytics to ask a clear question, find the signal, break it down, make one relevant change, and check again. If the problem turns out to be technical performance, SpeedBoostr can help with that part without pretending to solve the analytics itself.

